Helping you understand your retirement.
Savings and retirement are inherently random processes which makes it hard to plan for them reliably. This site allows you to run thousands of simulations of different retirement or savings scenarios to understand the likelihood of different outcomes. Normally when we think about saving for the future we think in terms of one value. For example, f I have two million dollars at age 75 I can retire, or if I save $1,000 a month, in 10 years I'll have ... This is easy to think about but in reality these numbers are much fuzzier. Since the stock market is random the Amount of money that you will have any given year is somewhat random which means that these future projections are distributions. By using Monte Carlo Sampling we can run thousands of simulations and get a representation of what the likely outcomes are for your finances at any future date. The way to use this site is to estimate distributions of wealth over time, and understand the simulated probability of failure under these simplifying assumptions.
Now is a good time to mention that I am not a retirement advisor, financial planner, investment manager, guru, or anything else that has legally binding requirements. I am just good at math. This tool is for general information and for fun only. Make your own decisions about investments.
Input Parameters
Initial Assets
Enter the starting amount of savings you have. If you're rich AF this is called capital. This could include your investments, savings accounts, mattress coins, or any other financial assets you plan to utilize during retirement.
Minimum Amount Withdrawn per Year
Specify the minimum annual withdrawal amount you plan to take from your portfolio during retirement. Feel free to try out a range of values from yacht collection to abject elderly misery. This value acts as a threshold for considering a year successful. If the portfolio can sustain withdrawals equal to or greater than this minimum amount, it is considered a successful year.
Number of Years of Retirement
Enter the expected duration of your retirement. The simulation will run for this duration and determine the amount of assets that you have at the end of retirement. Yes, this is a prediction of when you will die. Don't pick too early.
Portfolio Allocation
Define the portfolio allocation that best represents your assets. This field is a drop down menu which allows you to select a premixed portfolio from a large database of portfolios from the folks over at engineeredportfolio.com. The selected portfolio will represent your assets over the course of the simulation. When we randomly sample market performance for a given year the returns will be based on the historical performance of the selected portfolio. Try out different investments to get a sense of how they might perform, and really take to heart that “risk” is a synonym to “return.”
Withdrawal Strategy
Select the strategy you will use to withdraw money from your retirement portfolio. This represents how you choose to take money out each year. The options are:
- Constant Withdrawal Rate: This uses the common strategy of withdrawing a constant percentage of your portfolio each year. You'll often see folks talk about the 4% withdrawal rule. If you wanted to run that simulation, set Desired Withdrawal Rate to 0.04. Desired Withdrawal Rate only appears when this strategy is selected.
- Constant Withdrawal Amount: This strategy is similar to the Constant Withdrawal Rate strategy except that it uses a fixed dollar amount instead of a percentage. The fixed amount is set by the Minimum Amount Withdrawn per Year input.
- Vanguard Method: This is an implementation of Vanguard's recommendation for withdrawing during retirement. A full explanation can be found here
- Dynamic Minimum Withdrawal This strategy looks at the performance of the previous year and scales the withdrawal for this year based on what previously happened to the portfolio. For example if the portfolio lost money the previous year then the dynamic withdrawal strategy would take the minimum amount. If the previous year had huge returns it would scale up the amount that is withdrawn.
- Constant Saving Amount: This is a special case. This runs the simulation in reverse. which runs the simulation in reverse in order to tell you how much money you will have saved over time. Instead of withdrawing money, the system uses the input to `minimum amount withdrawn per year` as the amount that you are saving each year and the number of years is how long you want to simulate. For example, if you set the withdrawal to $1,000 and the number of years to 10, the results would be a range of how much money you might expect to have after 10 years.
Desired Withdrawal Rate
This option only appears when the Constant Withdrawal Rate strategy is selected. This is the percentage of your total assets that you'd like to withdrawal per year. The default value is 0.04 which is the well known4% rule.
Example
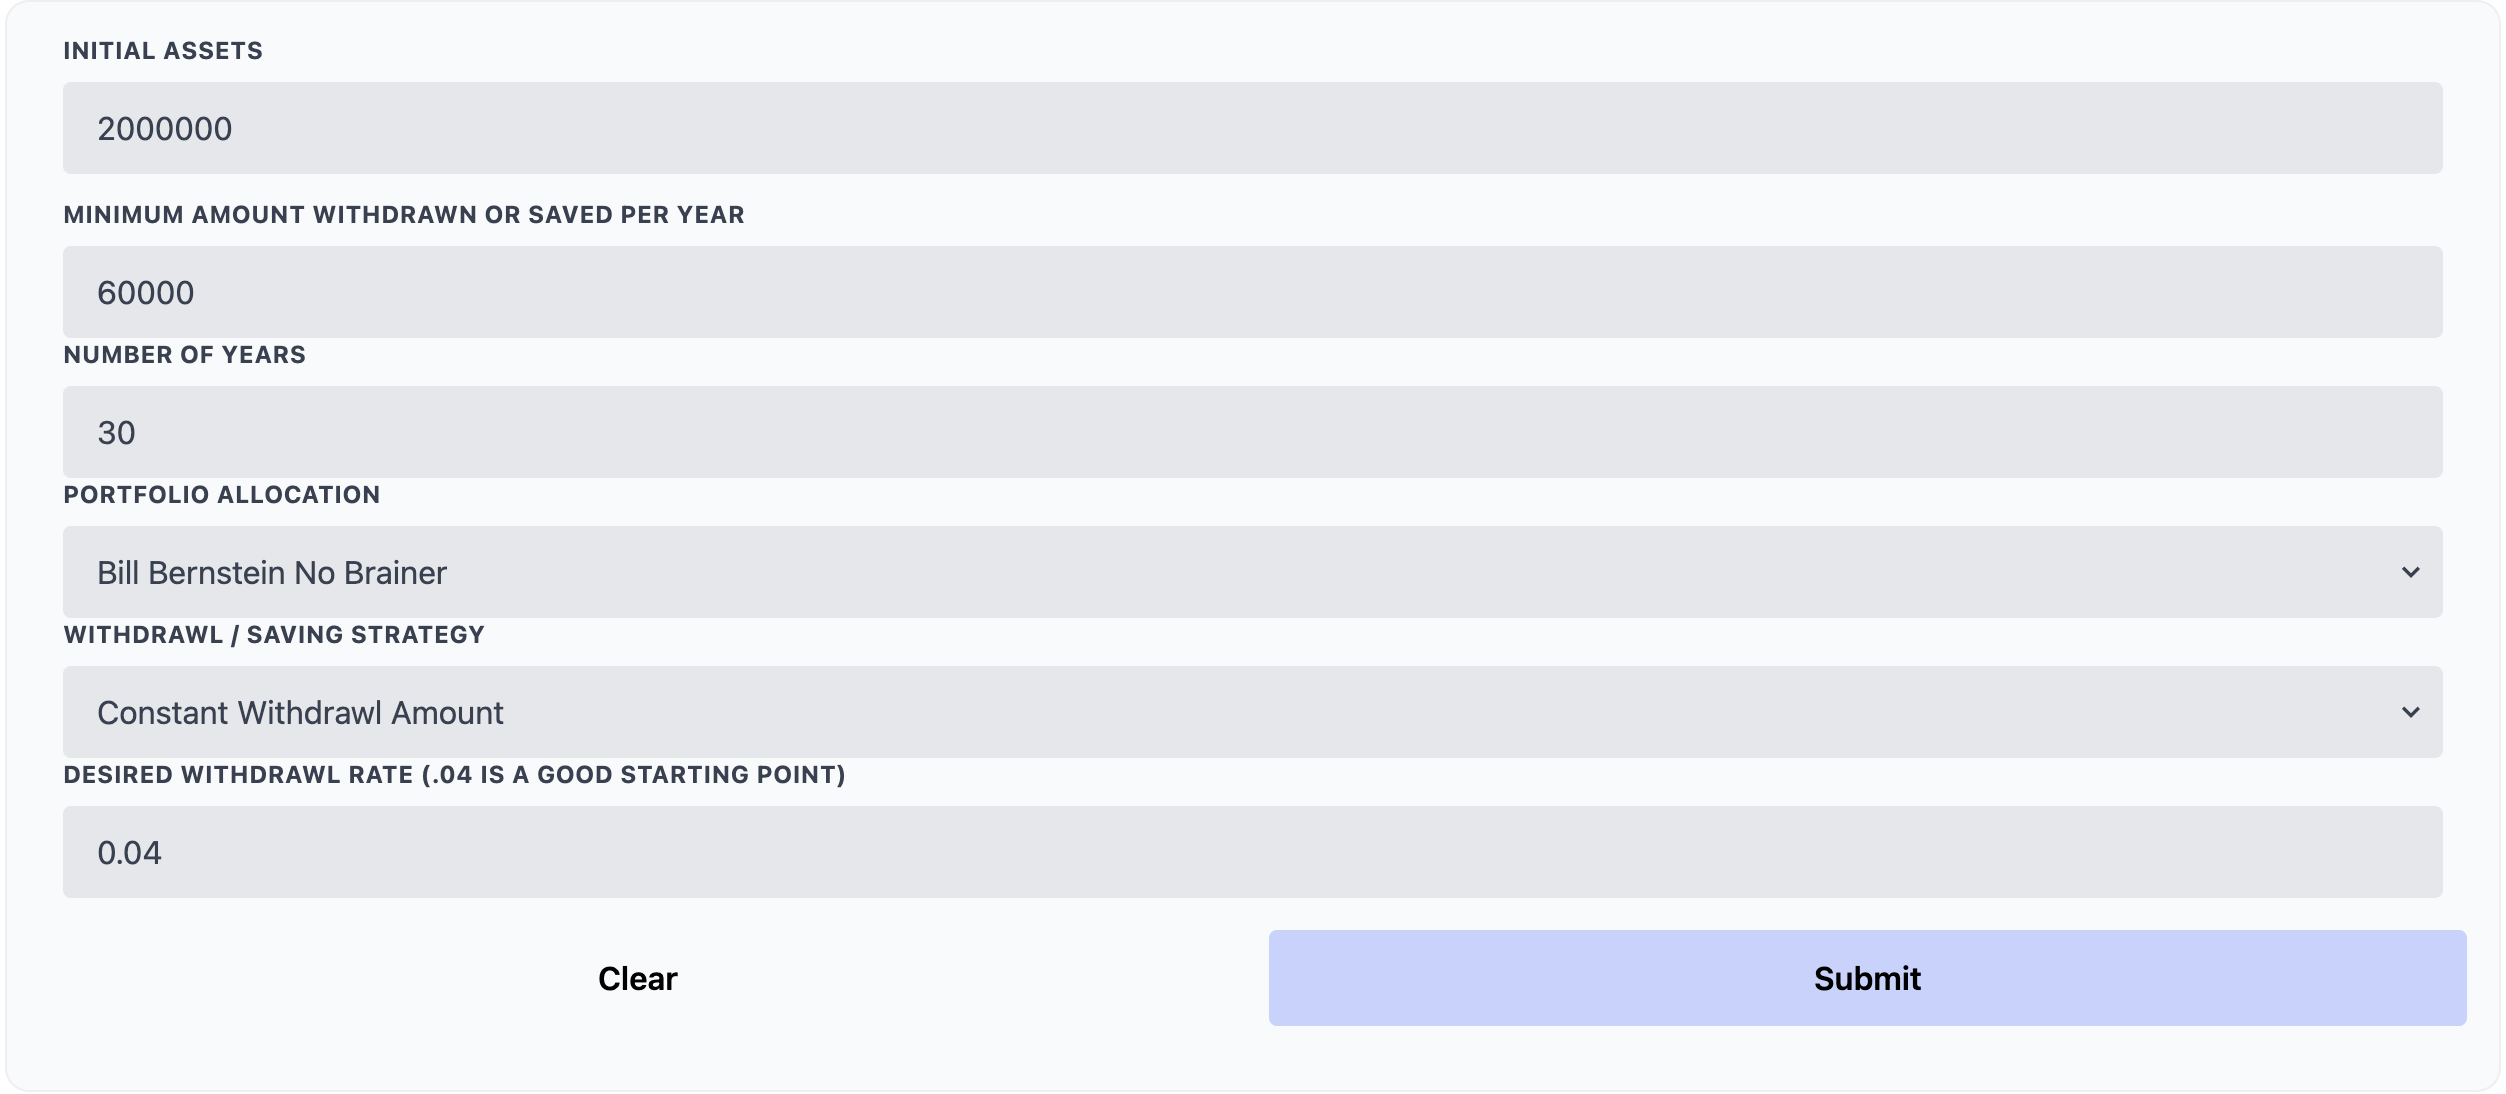
Let's run a retirement simulation for 30 years with $2 million saved using a constant withdrawal rate of $60,000 per year and Bill Bernstein's no brainer portfolio. This portfolio consists of:
- 25% in Vanguard 500 Index VFINX (IVW)
- 25% in Vanguard Small Cap NAESX or VTMSX (VB)
- 25% in Vanguard Total International VGTSX or VTMGX (EFA, VEA)
- 25% in Vanguard Total Bond VBMFX or VBISX (BND)
The input should look like:
After clicking Submit, wait a few seconds. The simulation takes some time to run. Once the simulation is complete you should see a table and some graphs.
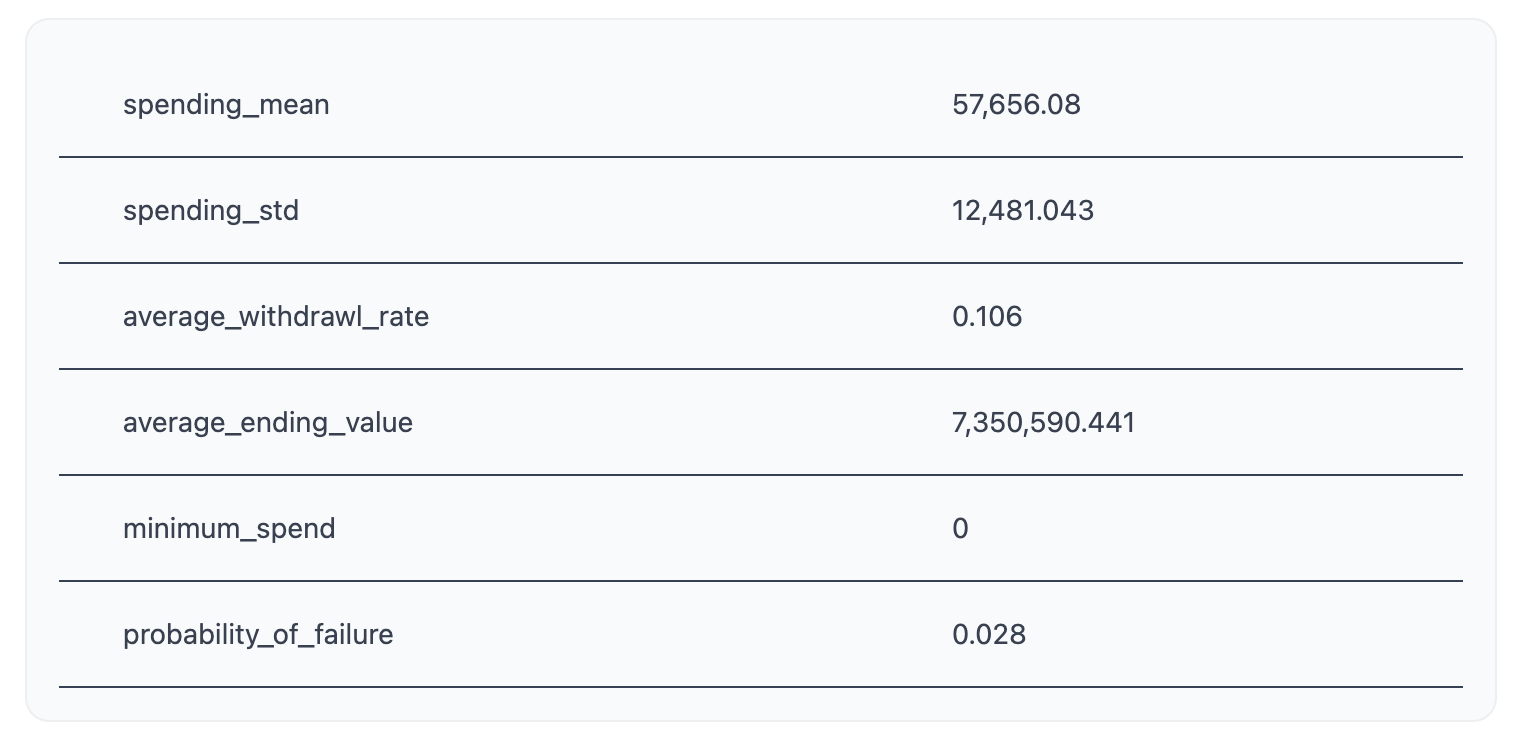
The summary statistics highlight the big picture behavior of the portfolio over time. Looking at this table we can see that the average amount that we spent per year was $57,656. This makes sense, most years we should spend that constant withdrawal amount, but due to market conditions some years we didn't have enough money so this is less than the total. The spending standard deviation tells you how much variation there was in the spending. So this means that about 68% of the time the spending was between 45k and 70k approximately. This measure isn't as informative for the constant amount setting because the amount is constant it will be more interesting under other strategies. The average withdrawal rate looks at the spending divided by the portfolio value of the previous year. This is the percentage of the portfolio that we spent each year. The average ending value is how much money on average you have at the last year of the simulation. If you want to die with $0, because you hate your family and want to leave them with nothing, then this should be $0. However, this leads to a high likelihood of failure, since the randomness of the market might send you to $0 earlier than you expected, which is exactly what your Scroogey-heart deserves in this thought experiment. Moving on, minimum spend is the lowest amount of money you spent in any given year. Probability of failure is the percentage of simulations that failed. If we ran 100 simulations and we ran out of money in two of them then this would be .02 like we see here.
Now let's take a look at the plots. The first is the total assets over time.
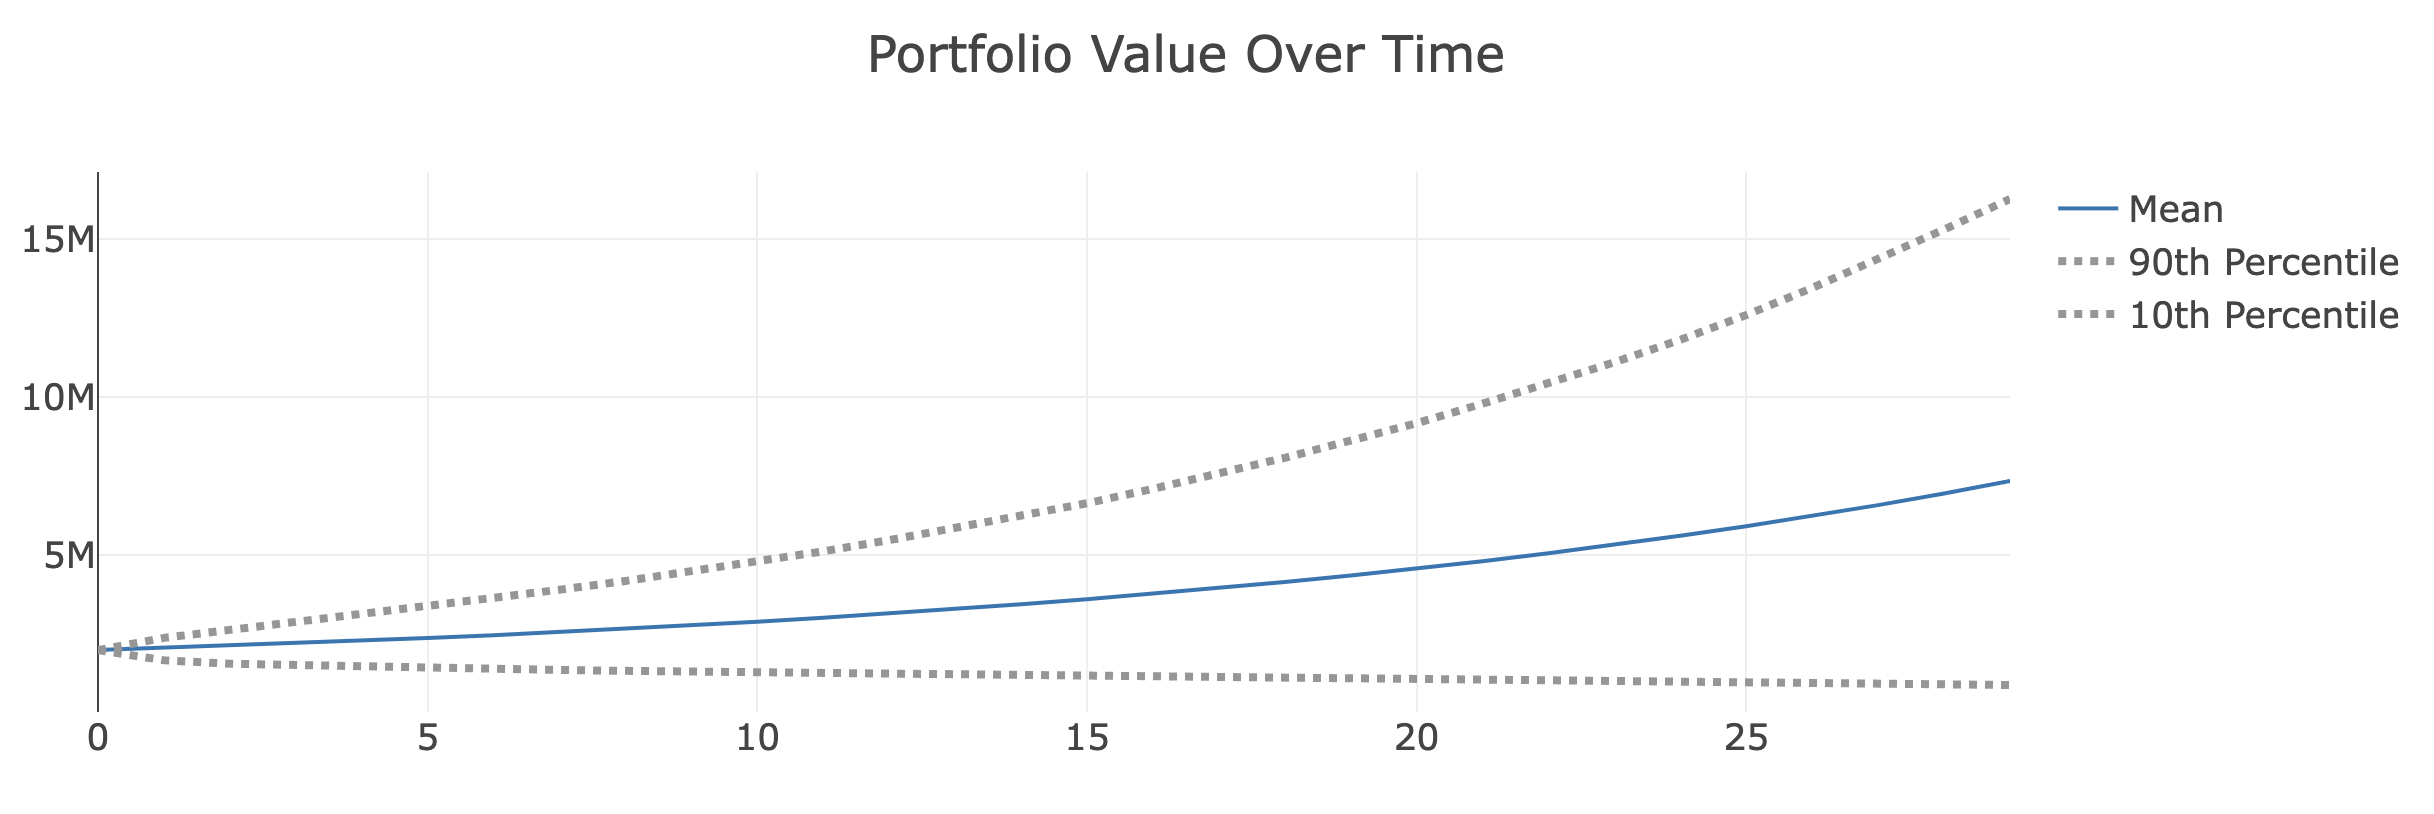
This represents the total amount of money present in the portfolio at any given time. The blue line is the average value and the grey lines bound it with 90% confidence. This means that in 90% of the simulations the value lies between the two grey lines. In this particular case 90% of the time when you are 20 years into retirement you should have between $0 and $9 million dollars (super helpful range) but on average around $5 million.
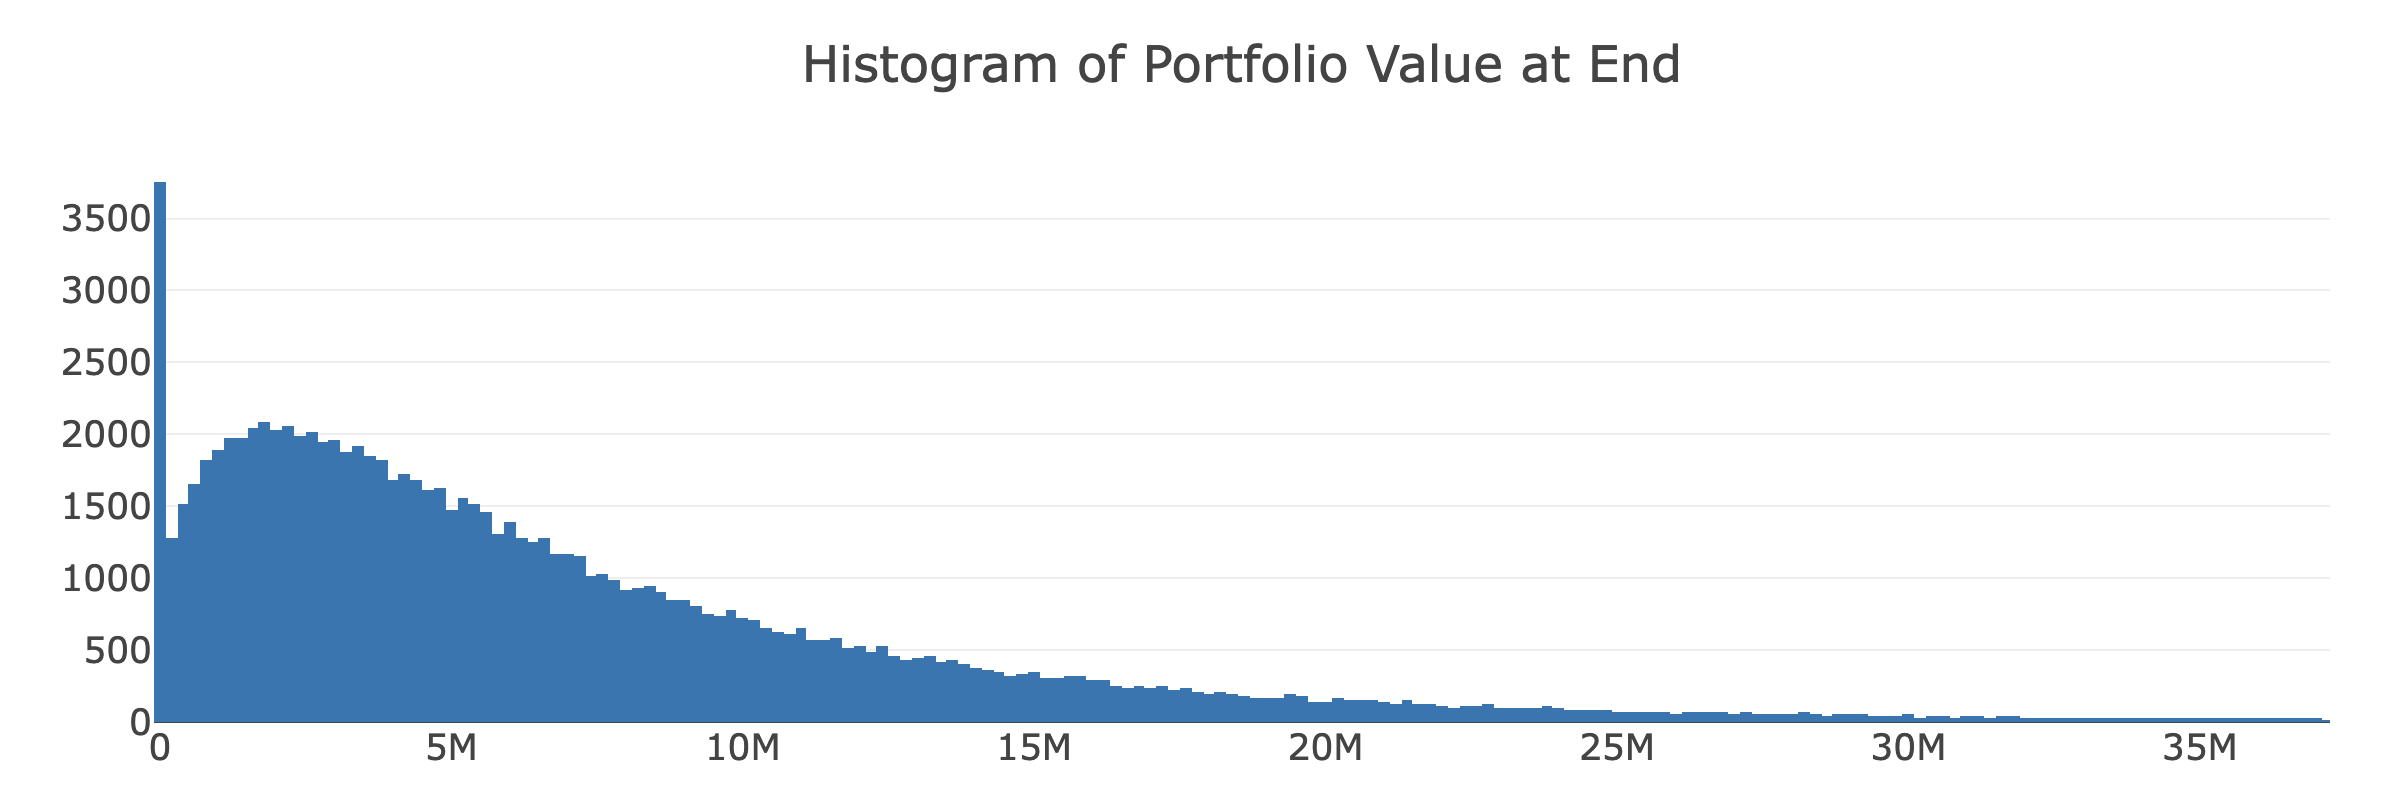
The next plot is a histogram of portfolio values at the end of the simulation. This shows you the distribution of how much money there is at the end of your time frame (when you estimate you will die). From this plot we can see that most of the values are around $5 million with quite a few at $0 and a long tale of unlikely booms where you're the preseident of the yacht club.